I just learned about Georg Nees, who was among the first people to create art using computers. I’ve never gotten deep into generative graphics, but find myself coming back to it every so often. Inspired by Nees’ 1968 piece Schotter (en: Gravel / Crushed Stone) I wanted to try my hand at manipulating squares using R.
library(tidyverse)

theme_set(theme_void() + theme(legend.position = 'none'))
Here’s the plan: Create a 10 columns / 20 rows grid of squares. The top squares should remain steady and organized. As we go down the rows, we rotate and displace them more and more.
First out: the square(). I create a simple data frame with one row containing x/y coordinates for each of the four corners.
I’ll later use geom_polygon to draw the shape:
geom_polygonwill close the shape, i.e. draw a final segment from the end back to the start. To usegeom_pathI would need the starting point a second time, as a fifth corner.geom_polygons can be filled, with colors.
square <- function() {
  tibble(x = 0.5 * c(1, -1, -1, 1),
         y = 0.5 * c(1, 1, -1, -1))
}

square() %>%
  ggplot(aes(x, y)) +
    geom_polygon(fill = NA, color = 'black') +
    coord_equal()
Next for a grid of squares. I want to rotate the points around the center of the squares. The center is at the origin (0, 0) when I create a square. The code is a fair bit easier if I rotate it around the origin. Therefore, my plan is to first create all the squares at (0, 0), rotate them in place, and spread them over the grid only once the rotations are done.
make_grid <- function(columns, rows) {
  tibble(square = 1:(columns * rows) - 1) %>% # Give each square a unique ID
                                              # Starting at 0 which simplifies the
                                              # calculations of column and row below
    mutate(points = map(square, ~ square())) %>%
    unnest(points) %>%
    mutate(column = square %% columns,
           row = square %/% columns)
}

spread_squares <- function(df, padding = 0.0) {
  df %>%
    mutate(x = x + column * (1 + padding),
           y = y + row * (1 + padding))
}

make_grid(10, 20) %>%
  spread_squares() %>%
  print() %>%
  ggplot(aes(x, y, group = square)) +
    geom_polygon(fill = NA, color = 'black') +
    coord_equal()
## # A tibble: 800 x 5
## square x y column row
## <dbl> <dbl> <dbl> <dbl> <dbl>
## 1 0 0.5 0.5 0 0
## 2 0 -0.5 0.5 0 0
## 3 0 -0.5 -0.5 0 0
## 4 0 0.5 -0.5 0 0
## 5 1 1.5 0.5 1 0
## 6 1 0.5 0.5 1 0
## 7 1 0.5 -0.5 1 0
## 8 1 1.5 -0.5 1 0
## 9 2 2.5 0.5 2 0
## 10 2 1.5 0.5 2 0
## # … with 790 more rows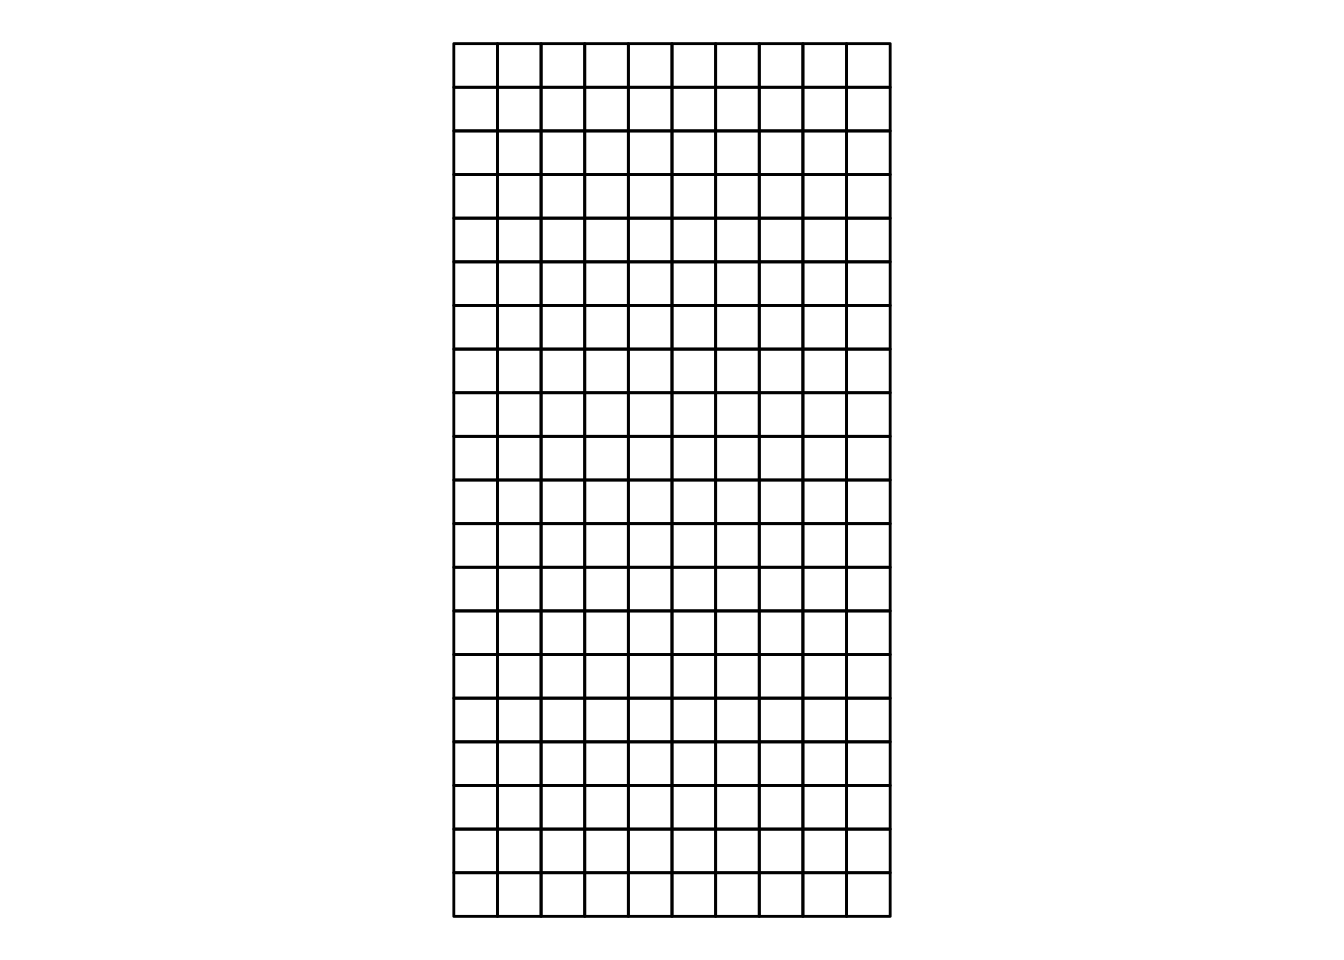
It looks like Nees did two transformations of the squares:
- Rotate the squares
- Move the squares
My rotation works by giving each corner an angle which it should rotate. I create a separate function to rotate() which takes a tidy evaluation parameter for angles. This lets me use either values or formulas based on columns in the data to rotate.
rotate <- function(df, angle) {
  df %>%
    mutate(xnew = x * cos({{angle}}) - y * sin({{angle}}),
           ynew = x * sin({{angle}}) + y * cos({{angle}}),
           x = xnew,
           y = ynew) %>%
    select(-xnew, -ynew)
}

# Rotate the squares 45 degrees = pi / 4 radians

make_grid(10, 20) %>%
  rotate(pi / 4) %>%
  spread_squares() %>%
  ggplot(aes(x, y, group = square)) +
    geom_polygon(fill = NA, color = 'black') +
    coord_equal()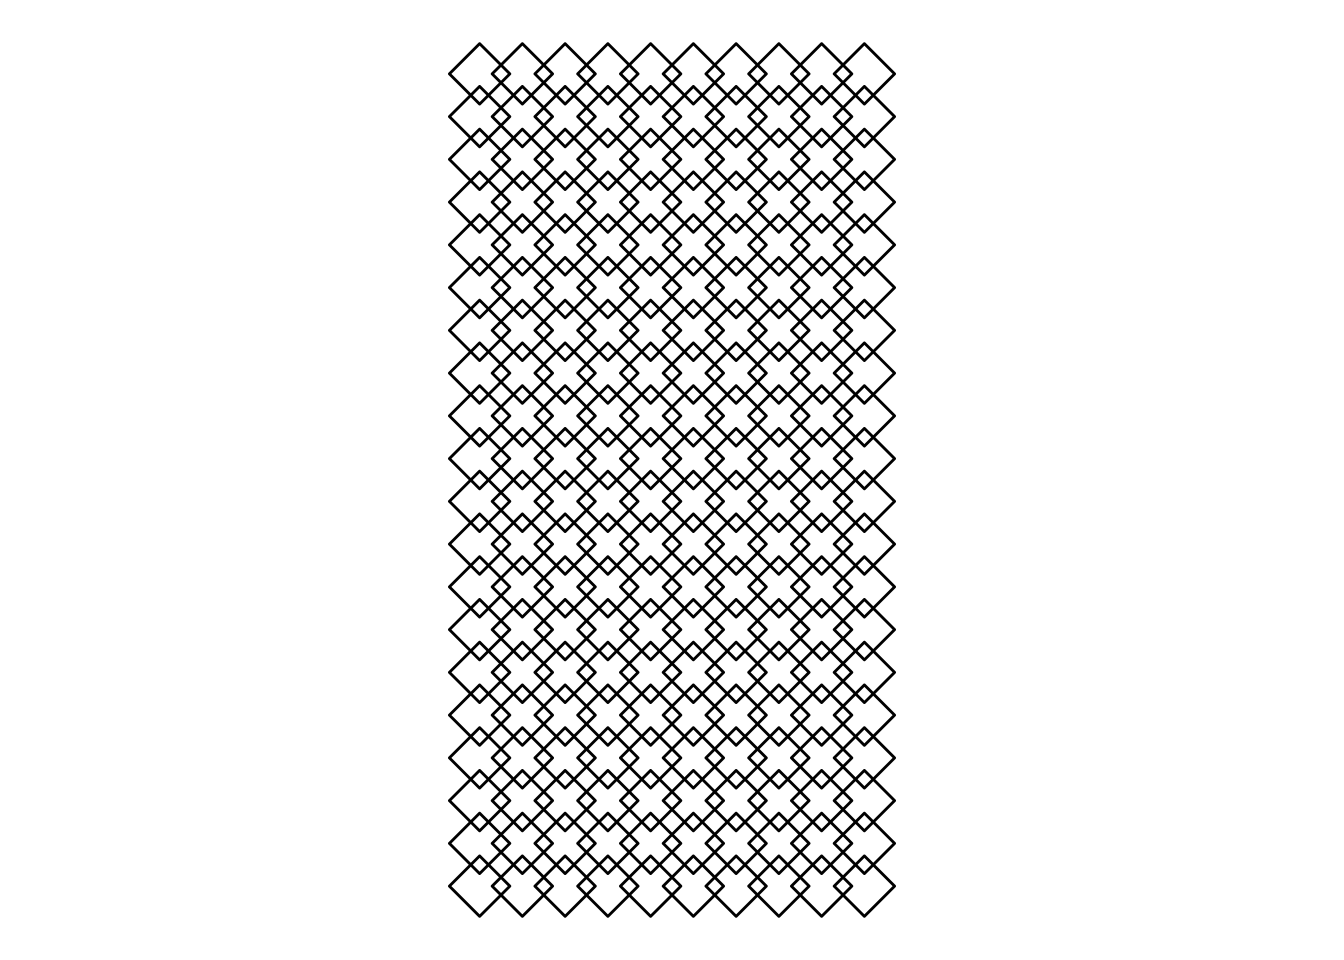
Schotter re-schottered
Now, all of the moving pieces are ready to recreate the picture.
I’ll index the topmost row for zero and make sure it plots correctly by scale_y_continuous(trans = 'reverse'). noisiness is our variable to determine how much noise to add by square. In this piece, it is simply how far down the rows we’ve come.
Since I want the square to remain intact when I rotate and move around, I need to move all its four corners together. For this, I group_by the square id and draw a single random number for all its corners at once.
I use normally distributed random numbers with increasing standard deviations. I did mine slighly less noisy than the original, in particular so for the displacement.
set.seed(1)

df.result <- make_grid(10, 20) %>%
  mutate(noisiness = row / max(row)) %>%

  group_by(square) %>%
  mutate(angle = rnorm(1, 0, noisiness * (pi / 2))) %>%
  ungroup() %>%

  rotate(angle) %>%
  spread_squares(padding = 0.2) %>%

  group_by(square) %>%
  mutate(x = x + rnorm(1, 0, noisiness ^ 2 * 0.3),
         y = y + rnorm(1, 0, noisiness ^ 2 * 0.3)) %>%
  ungroup()

df.result %>%
  ggplot(aes(x, y, group = square)) +
    geom_polygon(fill = NA, color = 'black') +
    coord_equal() +
    scale_y_continuous(trans = 'reverse')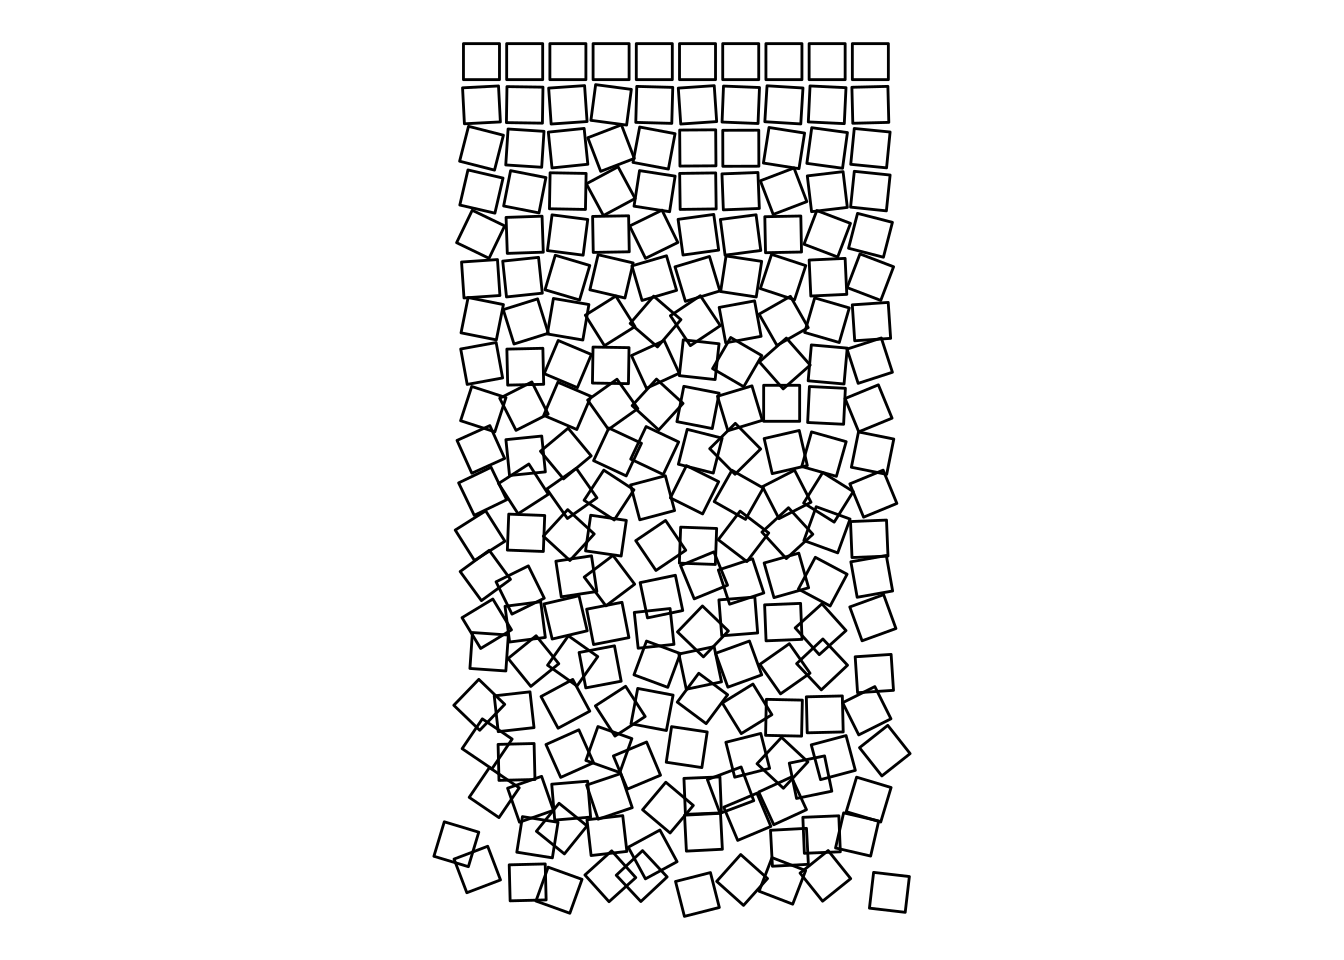
Finally, I add a little color and call it done!
df.result %>%
  ggplot(aes(x, y, group = square)) +
    geom_polygon(aes(fill = row), color = '#774F38', size = 0.5) +
    coord_equal() +
    scale_y_continuous(trans = 'reverse') +
    scale_fill_gradient(low = '#fcf0de', high = '#033649') +
    theme(panel.background = element_rect(fill = '#E8DDCB'),
          plot.background = element_rect(fill = '#E8DDCB'))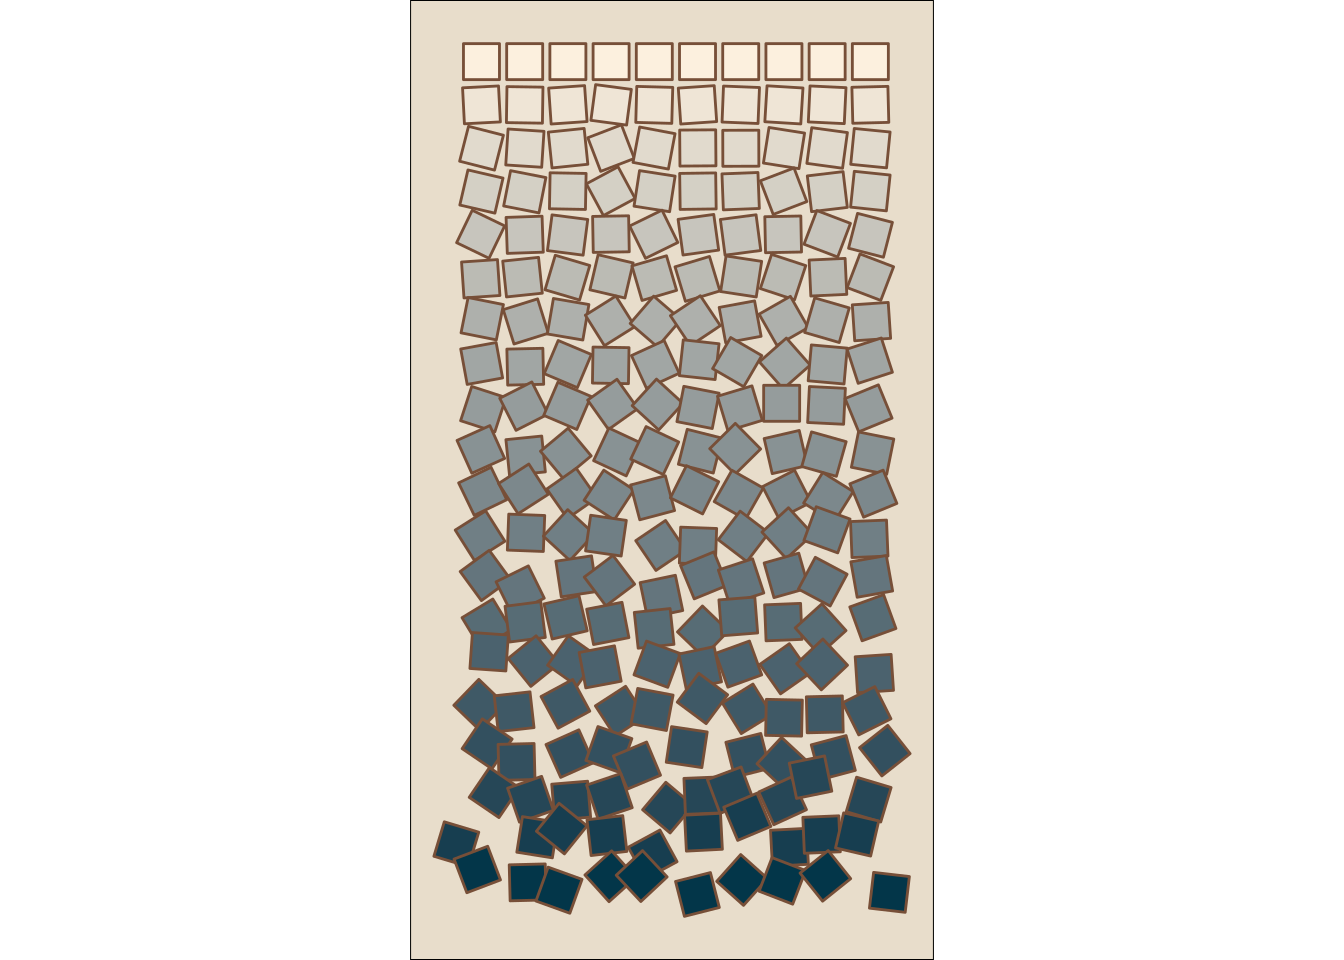
There’s all kinds of cool things you can try with this: Try polygons other than squares, try rotations by something other than a straight gradient from little to much, or try to transform each corner individually to gradually distort the squares as they fall.