Polar coordinates always surprise me. I have a hard time reading them, but they tend to bring an organic feeling to whatever I plot.
A simple piece of graphics to render is a [polar rose](https://en.wikipedia.org/wiki/Rose_(mathematics). In their most simple form, these are described with the polar equation: $$r = cos(k \theta)$$ where $\theta$ is the angle and $r$ the radius of each point. $k$ is a parameter that determines what the rose will look like.
library(tidyverse)
theme_set(theme_void())
rose <- function(k) {
tibble(theta = seq(0, 24 * pi, length.out = 1000)) %>%
mutate(r = cos(k * theta)) %>%
mutate(x = r * cos(theta),
y = r * sin(theta))
}
expand_grid(n = 1:7, d = 1:6) %>%
mutate(k = n / d,
title = paste0('k = ', n, '/', d)) %>%
mutate(flower = map(n/d, rose)) %>%
unnest(flower) %>%
ggplot(aes(x, y)) +
geom_polygon(fill = NA, color = 'black', size = 0.5) +
coord_equal() +
facet_wrap(~ title, ncol = 6)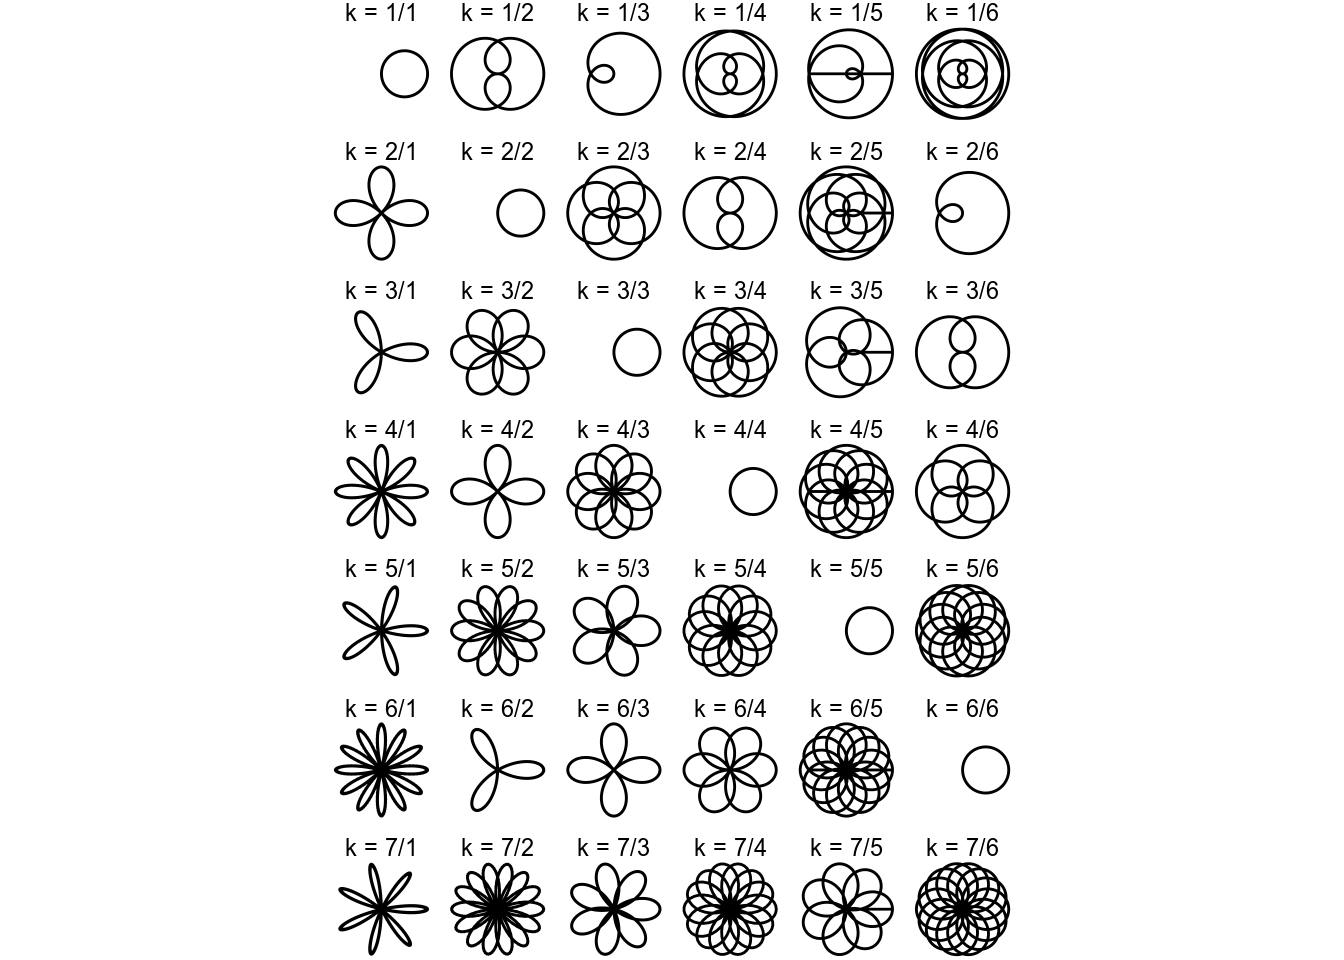
Besides these fundamental shapes, there are a few more parameters I can add to the rose generator for even more variation: $$r = \alpha cos(k\theta + \gamma) + \beta$$. These mean roughly:
$\alpha$is the size of the rose$\beta$shifts the pen drawing the rose, making for differently sized versions being drawn on top of each other$\gamma$rotates the rose
rose2 <- function(k, size = 1, shift = 0, rotation = 0) {
  tibble(theta = seq(0, 24 * pi, length.out = 1000)) %>%
    mutate(r = size * cos(k * theta + rotation) + shift) %>%
    mutate(x = r * cos(theta),
           y = r * sin(theta))
}

tribble(~k, ~size, ~shift, ~rotation,
        3, 1, 0, 0,
        3, 0.5, 0, 0,
        3, 1, 0.3, 0,
        3, 1, 0, 3) %>%
  mutate(flower = pmap(., rose2)) %>%
  mutate(title = paste0('size = ', size, '\nshift = ', shift, '\nrotation = ', rotation)) %>%
  unnest(flower) %>%
  ggplot(aes(x, y)) +
    geom_polygon(fill = NA, color = 'black', size = 0.5) +
    coord_equal() +
    facet_wrap(~ title)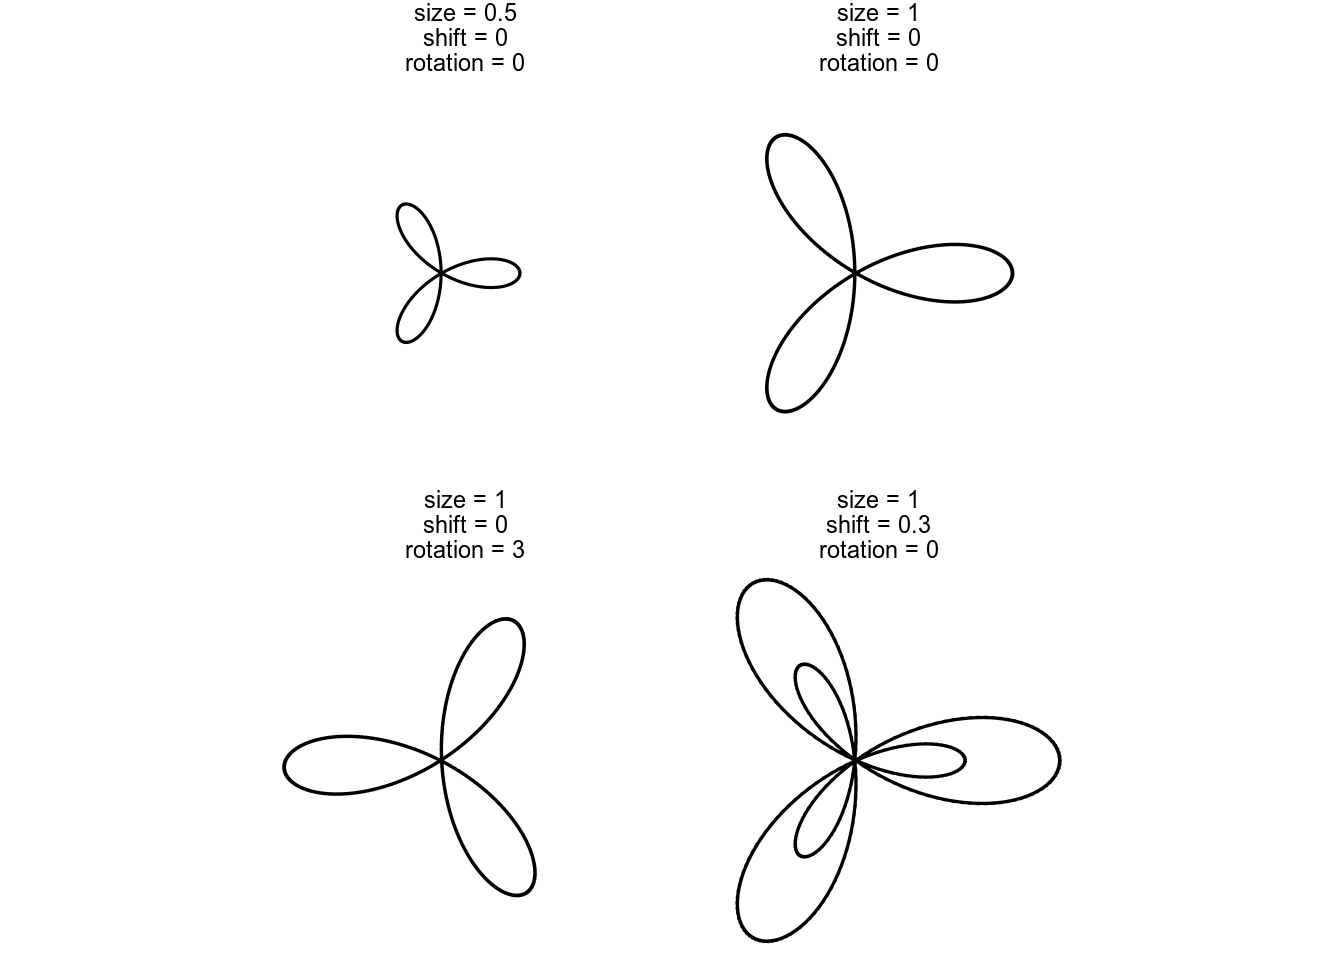
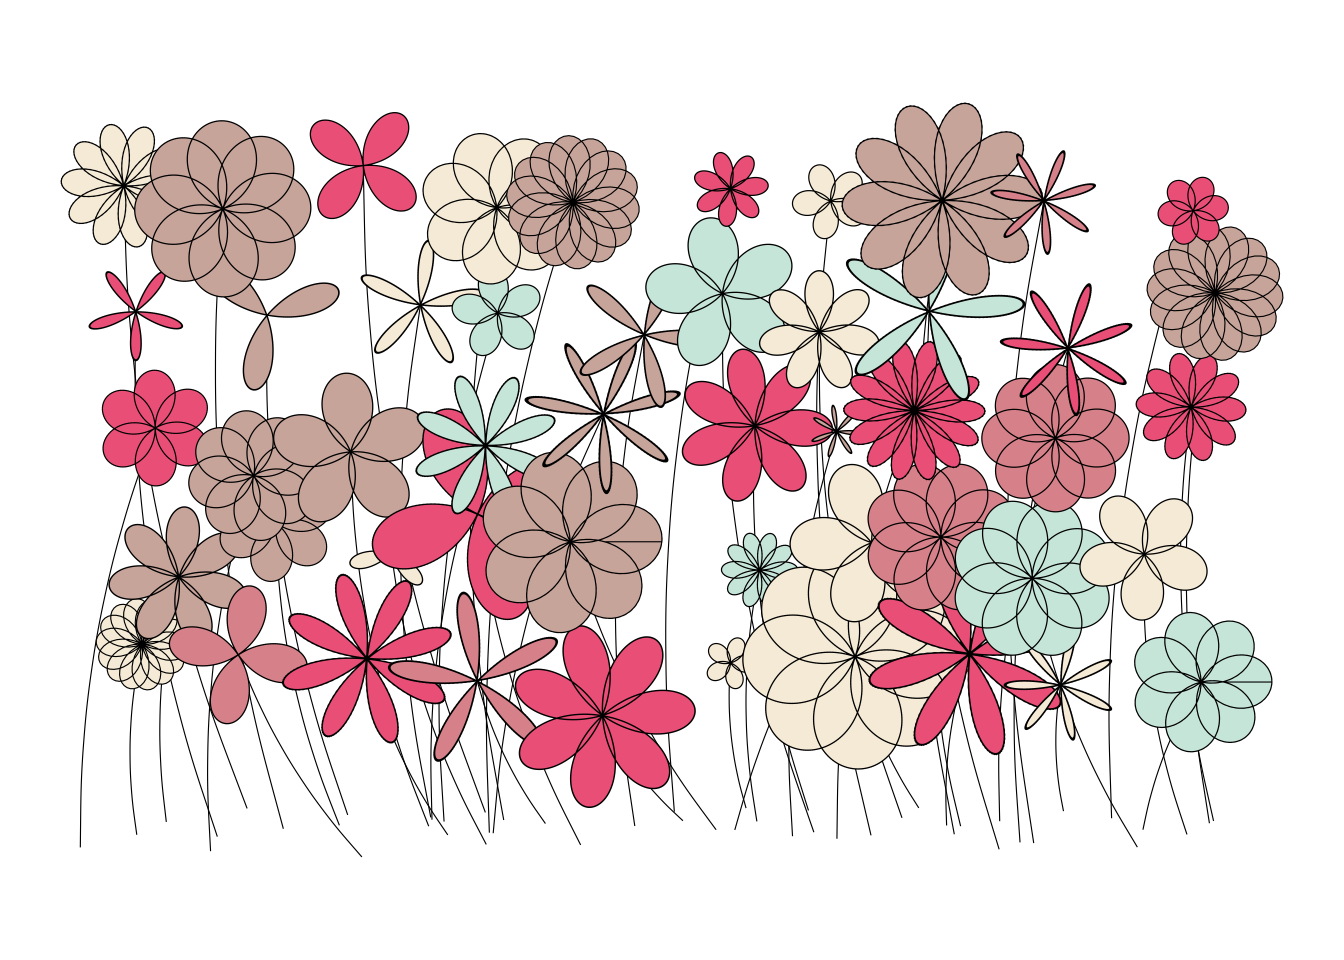
With this, let’s try to build a garden. I don’t like all the flowers in my grid. Instead, I do what any self-respecting gardener does: I pick my favorites. To get some nice colors, I also pick a nice palette from colourlovers.
colors <- lapply(colourlovers::clpalette(867235)$colors, function(c) paste0('#', c))

expand_grid(row = 1:5,
            column = 1:10) %>%
  mutate(id = column * max(row) + row) %>%

  # Randomize order of flowers, so they alter which ones are op top
  arrange(runif(nrow(.))) %>%

  # Randomize the parameters for the flowers
  mutate(k = sample(c(2, 3, 4, 5, 7, 3/2, 5/2, 7/2, 4/3, 5/3, 7/3, 7/4, 7/5), nrow(.), replace = TRUE),
         size = rnorm(nrow(.), 2, 0.75) + 1,
         rotation = runif(nrow(.), 0, 2 * pi),
         shift = runif(nrow(.), 0, 0),
         color = sample(colors, nrow(.), replace = TRUE)) %>%

  # Place them evently on a grid, but jitter them a bit to liven it all up
  mutate(center_x = column * 5 + rnorm(nrow(.), 0, 1),
         center_y = row * 5 + rnorm(nrow(.), 0, 1),
         stem_x = column * 5 + runif(nrow(.), -5, 5),
         stem_y = -2 + rnorm(nrow(.), 0, 0.5)) %>%

  # Generate the flowers
  mutate(flower = pmap(list(k = k, size = size, shift = shift, rotation = rotation), rose2)) %>%
  unnest(flower) %>%

  # Now that we have unnest()'ed all points, we have way too many stems. Let's keep only one per flower
  group_by(id) %>%
  mutate(stem_x = ifelse(row_number() == 1, stem_x, NA),
         stem_y = ifelse(row_number() == 1, stem_y, NA)) %>%
  ungroup() %>%

  ggplot(aes(x + center_x, y + center_y, group = id)) +
    geom_curve(aes(x = center_x, y = center_y, xend = stem_x, yend = stem_y), curvature = 0.1, size = 0.2) +
    geom_polygon(aes(fill = color), color = 'black', size = 0.2) +
    coord_equal() +
    scale_fill_identity()