This weekend I decided to give Julia try. I took the “Introduction to Julia” and the first half of “Parallel computing” courses on JuliaAcademy. I downloaded Atom and Juno, and I quickly skimmed McNicholas and Trait's Data Science with Julia. Then, off to the races!
… meaning Google. Lots of Google.
I wanted to keep working on my usual Quadratic 2D map plots. In particular, I've been looking for ways to interactively explore the neighborhood of parameters for an attractor. Given Julia's reputation of being fast and after seeing Makie‘s impressive interactive dataviz demos, this seemed like the task to try.
Making a long, stumbling and not very interesting long story short: turns out this was quite easy to do. Here follows the code I wrote. I put it here fully aware that I don't know how to use Julia well. It might be interesting for other people wanting to walk a similar path, and it will be interesting for future me to remember what I did wrong. I've run this code in only Atom/Juno; Works-for-me™ quality. Helpful pointers appreciated over here.
Code
First some imports.
using Makie
using .Threads
A function to generate a number of iterations from the 12-element vector of parameters a (see the blog post i linked to above). I create a threaded version, in which each thread starts from a random point and iterate a number of times. Adding threading via the @threads macro was brilliantly simple. As usual, threading requires you to write thread-safe code (the Multithreading video in the Parallel computing class mentioned above explained that well and succinctly, if you need a primer). For small workloads I didn't notice much of a difference (startup costs?). For larger ones, I got almost the ideal number_of_cores times speedup.
function quadratic_2d(a::Vector{Float64}; iterations::Int64 = 10000)
    x = Vector{Float64}(undef, iterations)
    y = Vector{Float64}(undef, iterations)

    iterations_per_thread = trunc(Int64, iterations / nthreads())

    @threads for thread in 1:nthreads()
        start = (thread - 1) * iterations_per_thread + 1
        stop = start + iterations_per_thread - 1
        x[start] = rand() * 0.2
        y[start] = rand() * 0.2

        for i in start+1:stop
            xp = x[i-1] # previous
            yp = y[i-1] # previous

            @inbounds x[i]  = a[1] + a[2]*xp + a[3]*xp*xp + a[ 4]*xp*yp + a[ 5]*yp + a[ 6]*yp*yp
            @inbounds y[i]  = a[7] + a[8]*xp + a[9]*xp*xp + a[10]*xp*yp + a[11]*yp + a[12]*yp*yp
        end
    end

    return (x, y)
end
The resulting data frame – the “trace” – is a long list of (x, y) points (well, one vector with x and one with y) with within whatever range it happens to have. To aggregate them conveniently, I want them in in a range of integers from 1 to whatever resolution I want. This lets me use the rescaled values as indexes into a count matrix in my next step.
function rescale(array; size = 1000)
    lower = minimum(array)::Float64
    upper = maximum(array)::Float64

    i_per_thread = trunc(Int64, length(array) / nthreads())
    result = Vector{Int64}(undef, i_per_thread * nthreads())
    @threads for thread in 1:nthreads()
        start = (thread - 1) * i_per_thread + 1
        stop = start + i_per_thread - 1
        for i in start:stop
            @inbounds result[i] = trunc(1 + (size - 1) * (array[i] - lower) / (upper - lower))
        end
    end

    return result
end
I want to count how many times the trace visited each cell in the rescaled grid. A matrix is a convenient representation, as it turns out to play nicely with the visualization library.
function normalize_attractor(attractor; width = 1000, height = 1000)
    x = rescale(attractor[1], size = width)::Array{Int64,1}
    y = rescale(attractor[2], size = height)::Array{Int64,1}

    counts = zeros(Int64, width, height)

    for i in 1:length(x)
        @inbounds counts[x[i], y[i]] += 1
    end

    return counts
end
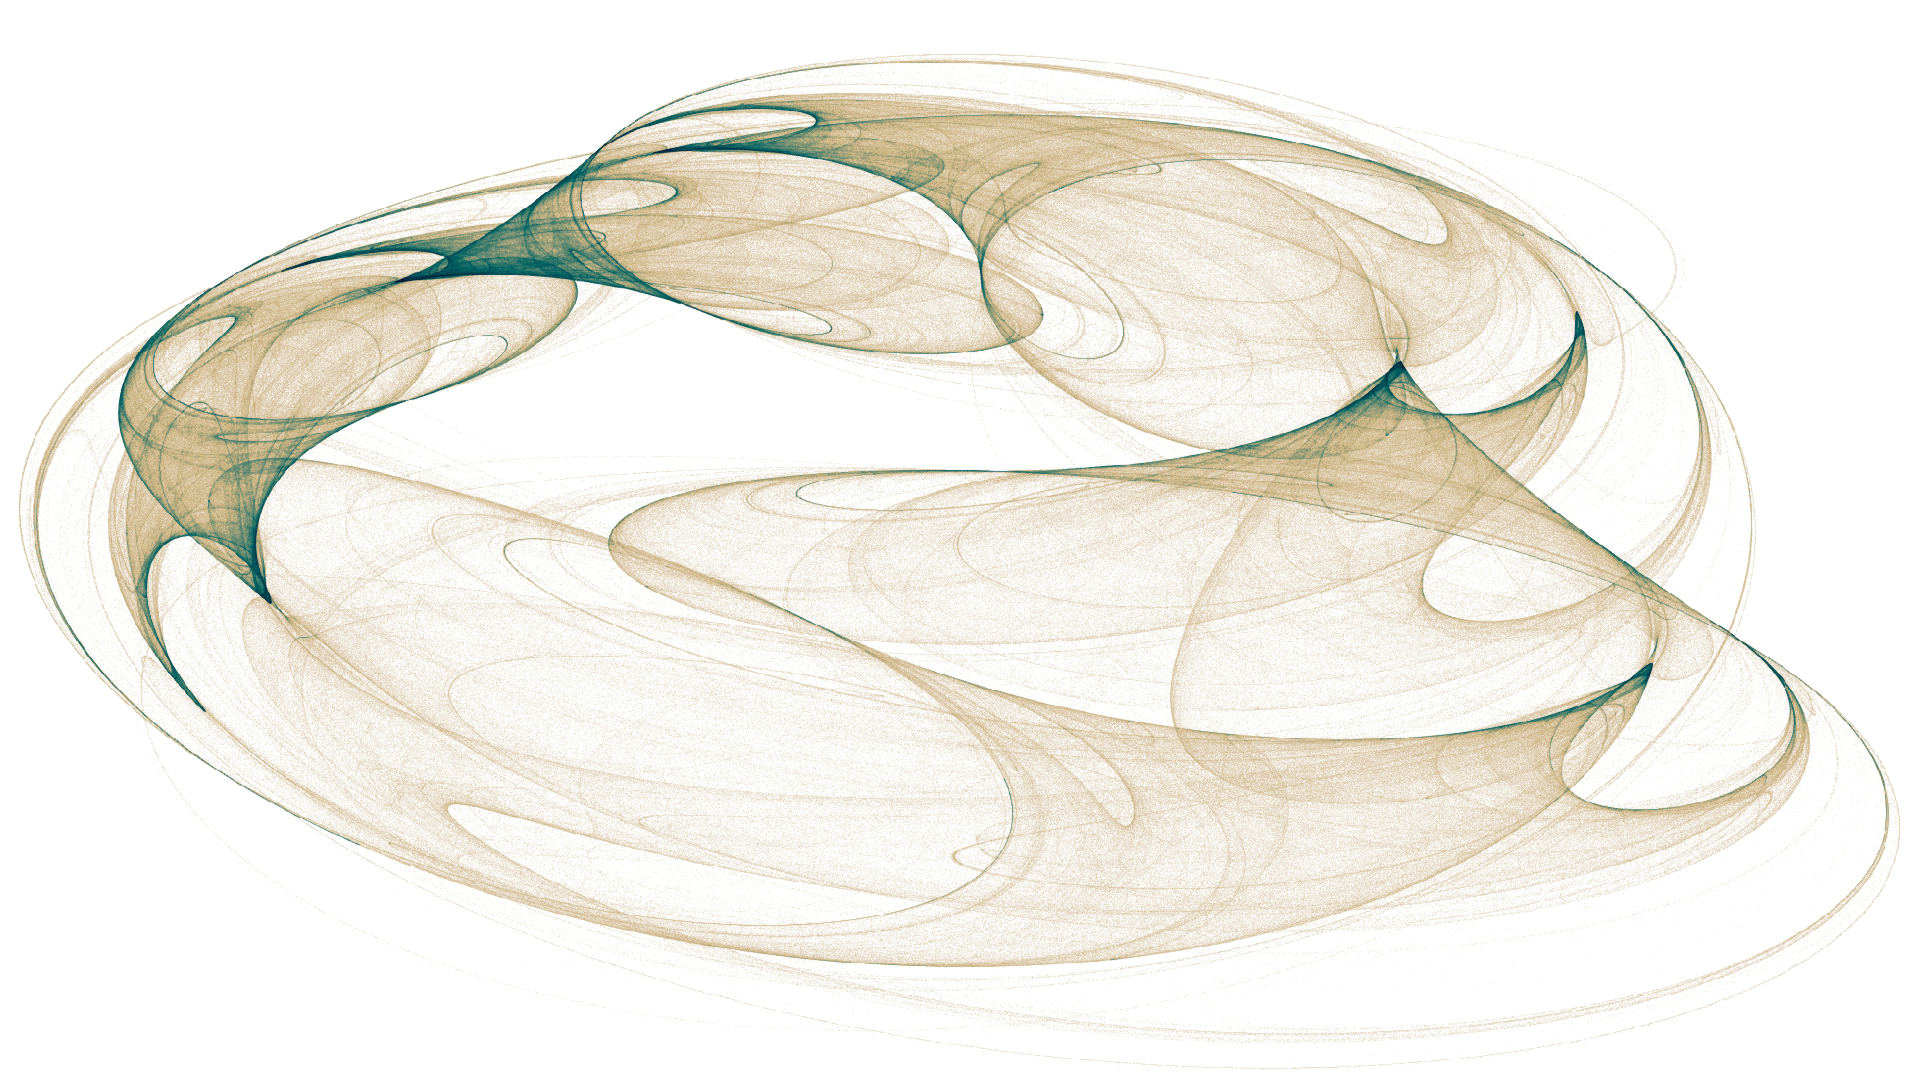
I chose an old favorite attractor of mine to render. For interactivity, the Makie documentation desribes a structure similar to R {shiny} reactives. The library also offers some interactive inputs which I want for a UI.
After browsing the Makie web page, documentation, gallery and Stack Overflow sections I was able to tie it all together.
fingers_a = [-0.38, -0.60,  0.20, -0.79,  0.10,  0.54,  0.41, -0.59,  0.95, -1.19, -0.65, -0.66]

width = height = 800
a = copy(fingers_a)

sl = [
    slider(LinRange(a[i] - 0.2, a[i] + 0.2, 200), raw = true, camera = campixel!, start = a[i])
    for i in 1:12
]

# I'm sure I don't use the language and/or API well here...
norma = lift(
    [sl[i][end][:value] for i in 1:12]...
) do s1, s2, s3, s4, s5, s6, s7, s8, s9, s10, s11, s12
    try
        a = [s1, s2, s3, s4, s5, s6, s7, s8, s9, s10, s11, s12]
        attractor = quadratic_2d(a, iterations = 5 * width * height)
        return log.(normalize_attractor(attractor, width = width, height = height) .+ 1)
    catch
        # With most parameters, the generation will fail. We don't care to handle
        # that more gracefully than to show a blank image.
        return zeros(width, height)
    end
end

plt = heatmap(
    norma,
    colormap = [:white, "#E8DDCB", "#CDB380", "#036564", "#033649", "#031634"],
    show_axis = false,
    resolution = (width, height)
)

RecordEvents(
    Makie.hbox(
        plt,
        Makie.vbox(sl[9], sl[10], sl[11], sl[12]),
        Makie.vbox(sl[5], sl[6], sl[7], sl[8]),
        Makie.vbox(sl[1], sl[2], sl[3], sl[4]),
        parent = Scene(resolution = (width, height + 200))
    ),
    "output"
)
This turns out to be fast enough to use! With 5x800x800 = slightly more than 3 million iterations per image, the image updates at something like 10 fps on my i5/no-GPU laptop. I don't have an equivalent benchmark from R at hand, mostly since I don't know of a convenient real-time rendering library. Compared to my previous experiments in {shiny} on top of Rcpp generated data, I'd guess that this is roughly an order of a magnitude faster. But then again, this would be comparing native rendering against PNGs in HTML.
By the way, it is really cool to finally be able to play interactively with these parameter. There is so much beauty hidden in these twelve dimensions.
Impessions of Julia
Given that I don't even have a full day of experience with Julia, here are some first impressions.
I like many things about Julia. The language seems both readable and writable. There are several constructs I have missed from Python, for example list comprehensions and a nice syntax for returning multiple values. The dot syntax to vectorize functions is really nice. And I imagine that there are a ton more of useful macros and other metaprogramming tools.
I have way too little experience to say anything bad, but here's a few things I'm still confused by. I don't yet have a good intuition of when, where and why I should type variables. Error messages are always like learning local slang – I understand the words, but only experience will let me make sense of them. And I miss the good old RStudio. In other words: unfamiliarities.
Then again, I've only scratched the surface. I've been impressed by what I've seen so far and I sense that there are tons of goodies to discover.